In this Australian real estate market update, property prices continue to rise despite supply challenges. With banks cutting rates but no interest rate reductions from the RBA, many are questioning if a market crash is looming. Discover how to navigate the current market, position yourself for both growth and potential downturns, and why working with experts is crucial during these uncertain times.
So, prices are hitting all-time highs again, yet we don’t have enough supply coming into the market.
Additionally, there’s a lot going on with banks cutting rates, but the RBA hasn’t made any mention of interest rate cuts.
If you’re interested in knowing my thoughts on this wacky world of real estate here in Australia, then definitely keep reading.
Why Are Property Prices Still Rising Despite Supply Issues?
Now, the latest data has come out, as reported by PropTrack.
According to the report, this is the 20th consecutive month that we’ve seen prices go higher. At this point, some people are in complete disbelief because we were promised that the market was going to crash.
On the other side, you’ve got people saying: No, the crash is coming. It’s happening today, tomorrow, or probably next week.
Is a Crash Coming Soon?
Overall, I’m an optimistic guy, but I’m not afraid to admit that over the next 3 to 5 years, we’re going to see huge amounts of money changing hands—and it’s no joke.
Some people are going to get caught out because they overleveraged themselves, or they picked up property in the wrong area.
This is why you need experts around you. I feel like, to a certain extent, we’ve been playing in Easy Mode over the last couple of years.
I’ve been doing this for about 11 or 12 years, and I’ve seen the kinds of properties people buy and the types of deals some buyer's agents are making. And I’m like: Mate, these are the things that get people into serious trouble.
Instead of sitting there in fear, worried about what could happen or whether the market is going to crash, why not outsource that stress? Get the experts to do what they do best—guide you into the market at the right time.
We’re going to see huge growth over the next few years, but we will also see some sort of correction. You want to be positioned for both.
Why? If you can position yourself for both the growth and the potential decline, I’m telling you—it’s life-changing money.
Think about everyone who bought during the time of the Global Financial Crisis (GFC) or right after it. That’s when you can time the market perfectly and make a lot of money.
You can’t just say: Oh, I’ll buy anywhere and hope the market goes up.
We’ve also got the following:
Monthly growth
Annual growth
Median value
As you can see, national prices went up by 0.2% this month, but annually, they’re up 6.2%.
Why is this data so skewed?
Because it takes large areas into account.
For example:
The capital city is up 0.3%
Sydney is up 0.3%
Melbourne is down 0.2%
Brisbane is up 0.4%
Adelaide is up 0.5%
Perth is up 0.8%
So, it’s just an average, and that’s why you need to take it with a grain of salt.
You need to dive deeper into the data; otherwise, you won’t get the full picture.
This gives you a high-level view of what’s happening on the ground, but when you look at the annual numbers, you can see some outliers.
Going back to the photo above:
Brisbane is up by 14%
Adelaide is up by 15%
Perth is up by 23%
Now, that’s absolutely wild, especially when compared to Melbourne, which is trending in the opposite direction.
There are calls out there saying: Well, let’s counter-trade this. Let’s go to Melbourne because everyone else is looking elsewhere.
But that’s probably the wrong way to counter-trade. It’s often referred to as “catching a falling knife.”
Think about it: a falling knife is dropping, and you’re thinking, I’m so smart. I’m going to get into this market before anyone else. But as you try to catch the falling knife, it slices you open.
Now, I don’t condone any sort of violence, but the reality is people are going to get wrecked trying to pick the bottom of the market. Because when you pick bottoms, you get smelly fingers. (Haha! I’m on fire today!)
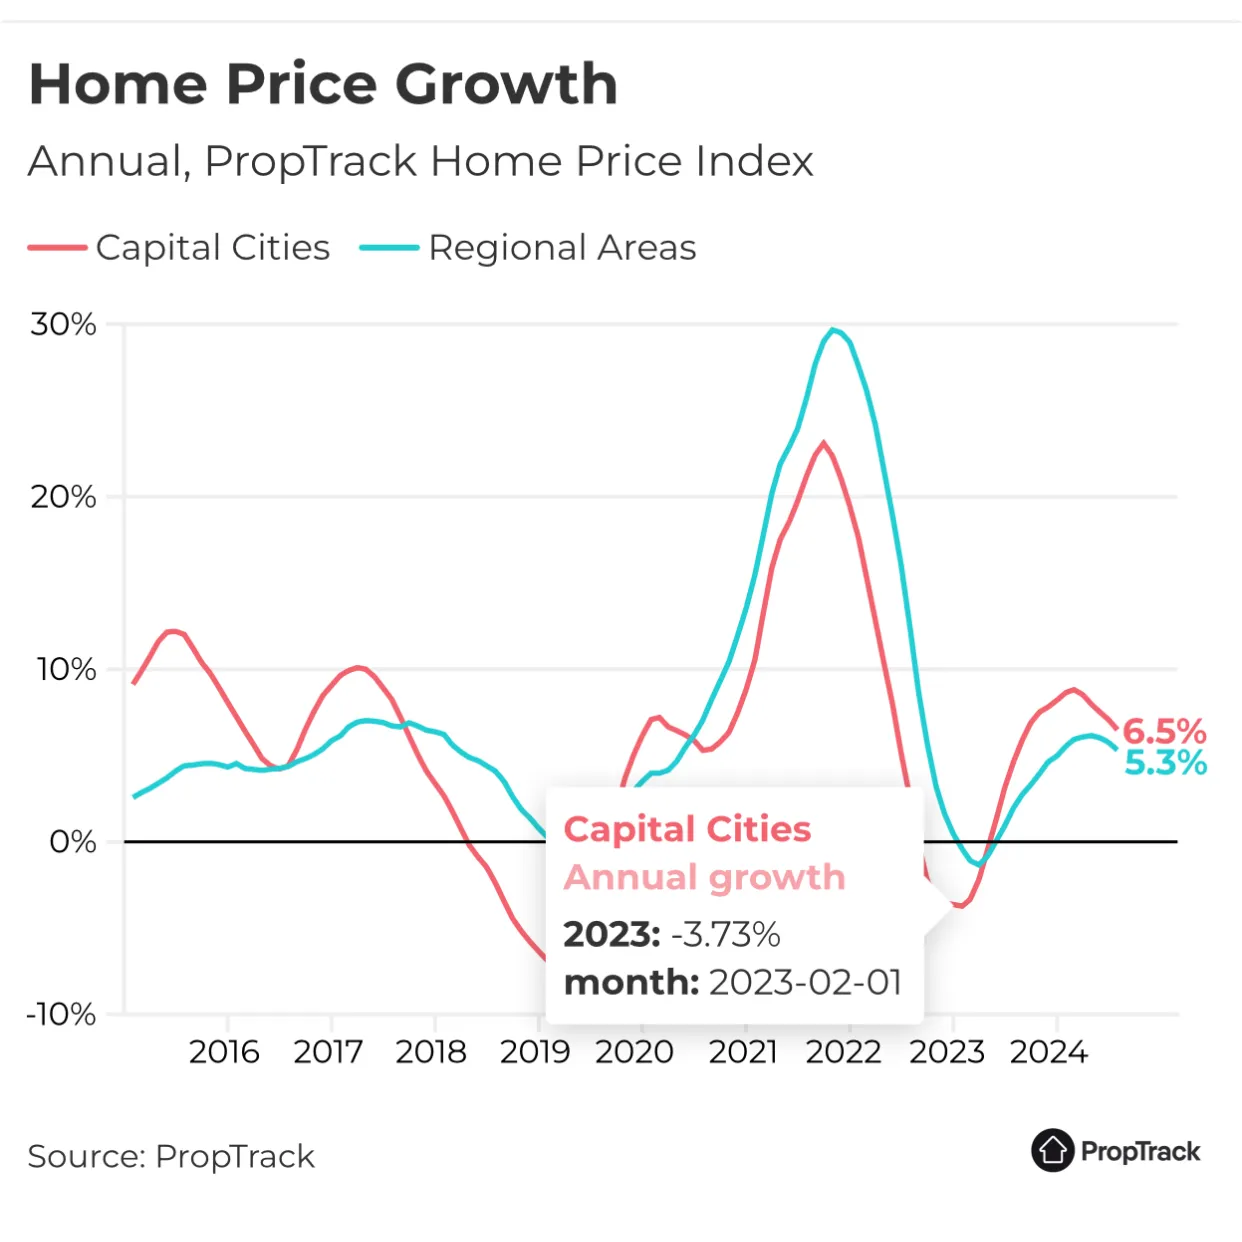
Okay, now let’s look at this cool little graph:
We’ve got annual growth rates at 6.2%.
There’s speculation that we’ve peaked in terms of the rate of growth, and we should start seeing this slow down.
Again, this is an average. So if we see larger markets like Sydney and Melbourne slow down even further, then yes, these numbers will likely drop.
What I’ve been talking about for the last four years is this graph here.
Red represents capital cities.
Blue represents regional areas.
Four years ago, I said: look, what you need to do is protect your downside, and position yourself for whatever crash or correction might come next. Additionally, you also want to be in the right areas to give you the maximum amount of growth.
To me, if I looked at the graph above objectively, I’d say the blue line (regional areas) is the one I want to be in. That’s because when I see the dips, they’re so much larger in the red line (capital cities).
Now, comparing it to the regional areas, they hardly dropped.
When I look at the increase, I see in 2021, we saw growth of 23% for capital cities.
However, it was closer to 30% for regional areas.
When interest rates went up, we again saw the dip in capital cities by 3%.
However, we saw a dip in the regional areas by just over 1%.
Therefore, to me, what I want to do is get into areas that have less volatility. So, even if the market moves sideways or dips slightly by a couple of percentage points, that’s the market I want to be in.
Why? Because when times are good, these markets often take off.
Even if you look at a graph like this—even if you picked the worst time to purchase property, and you saw a decline of 7%, you would actually be at all-time highs only a couple of years later.
This is why it’s so important to have the right strategy and plan—not just go out there and fluke it. And definitely don’t go out there taking risks with house and land packages or off-the-plan units, because that will be a shortcut to failure.
New Housing Approval Numbers Released!
In addition, we’ve also seen housing approval numbers come out, and this is where it starts to get very interesting.
One of the key things I’ve mentioned in my previous blogs and YouTube videos is supply.
You can’t just say: Oh, this is a really popular area. Everyone’s going to want to buy there.
Yeah, that’s great, but if it’s really popular and there’s available land or zoning that allows for multiple stories of units to go up, that means there’s going to be a lot of supply coming out too. So, the supply might still outweigh the demand.
Think about it: we go out there, and say there are 10 people who want to buy a house in this area, but there are 12 properties available. That means the buyers have a choice—they can say: If I don’t want to buy this property, I can buy that one. There are fewer buyers and more properties.
Now, if the opposite occurs, where there are 100 people interested in the area (10x the popularity), it might seem like a good thing. But what happens if I tell you that supply is sitting at 500 properties?
You’d say: Well, that means prices will go down a lot because there are still so many houses available, even after those 100 people buy what they want.
This is why you need to understand both sides—not just look at it and say: Oh, well, everyone wants to move to Melbourne, fantastic.
However, there’s a huge amount of supply there, which is why I wouldn’t touch that market.
Now, the report also added that:
Let’s look at this other graph:
In the dark blue, we see detached homes.
In the light blue, we’ve got attached homes.
Although we can start seeing a slight tapering off and maybe even a potential increase, it’s still significantly lower than the averages from the last five years.
This is why there’s concern—we’re not going to have enough supply coming onto the market, especially if interest rates don’t start dropping.
Why? Well, think about it.
You need to get the approvals, so the government’s got to play their hand in giving you faster approvals, and we all know nobody’s fast these days.
Also, you’ve got the banks to consider, as they have to be willing to lend for construction loans. Once that happens, and you have the ability to borrow, you can go and build. But that’s still going to take 12 to 18 months, depending on what you buy and build.
It’s pretty sad to see that we’re in an environment where we can’t build enough homes.
Now, upon reading this, you might say: Well, it’s simple. Just stop immigration.
However, we’ve already discussed why that’s not likely, because the economy is just holding on as it is.
We’ve started seeing banks coming out and slashing their home loan rates, as well as their term deposit rates. Now, once term deposit rates start dropping, and people realise their money isn’t being put to good use, that’s when some of them will start using that money to either:
This is why interest rates get cut—because it means the economy is slowing down, and we need more money to go in and start transacting.
You can do this by buying assets, because there are taxes and other considerations involved, or you can go out there, spend at cafes and restaurants, and splurge.
I hope you guys have learned so much from me in this article.
If you're wanting to make some moves and move at speed, then definitely contact our team by booking a free discovery call.
Catch you all on the next one!
Thanks guys!
Disclaimer: Important Notice for Readers
By reading the content provided on this blog, you acknowledge and agree to the terms outlined in this disclaimer, binding yourself to its provisions unconditionally.
This blog presents information for informational, educational, and general non-advisory purposes only. It's important for you, the reader, to understand that the information provided does not take into account your specific personal, financial, or other circumstances. Consequently, we do not offer legal, financial, investment, or taxation advice, recommendations, or guidance. Before acting upon any information from this blog, you are strongly advised to consult with an independent professional, including legal, financial, taxation, accounting, or other relevant advisors, to verify the information’s relevance to your particular situation.
The information is provided in good faith, derived from sources believed to be reliable. However, we do not guarantee the accuracy, completeness, or applicability of the information to your individual circumstances, needs, objectives, or financial situation. The information may be selective and has not been independently verified. Therefore, it should not be the sole basis for any decision-making.
We expressly disclaim any liability for errors, omissions, or inaccuracies in the information, as well as any direct or indirect losses, damages, or expenses that arise from relying on our content, regardless of the cause, including negligence or other factors. Your engagement with this blog is entirely at your own risk.
Please be aware, we do not hold an Australian Financial Services Licence as defined by section 9 of the Corporations Act 2001 (Cth), nor are we authorised to provide financial services, and we have not provided financial services to you.
Disclaimer: Search Property Pty Ltd (SP) does not provide financial or investment advice and does not hold a financial services license as defined in the Corporations Act 2001 (Cth). Any advice given by SP is general in nature and does not take into account your personal circumstances or objectives, financial situation or needs.


.png)

.png)
.png)
.png)
.png)
.png)
